Understanding Truckload Freight Rates in the USA: A Detailed Overview for 2024
In the trucking industry, the cost of transporting freight over long distances is a crucial factor that affects both shippers and carriers. The rate per mile for truckload (TL) freight in the USA varies widely based on several critical factors. This comprehensive guide will explore the nuances of these rates for 2024, offering insights into the key determinants and trends shaping the industry.
1. Overview of Truckload Freight Rates
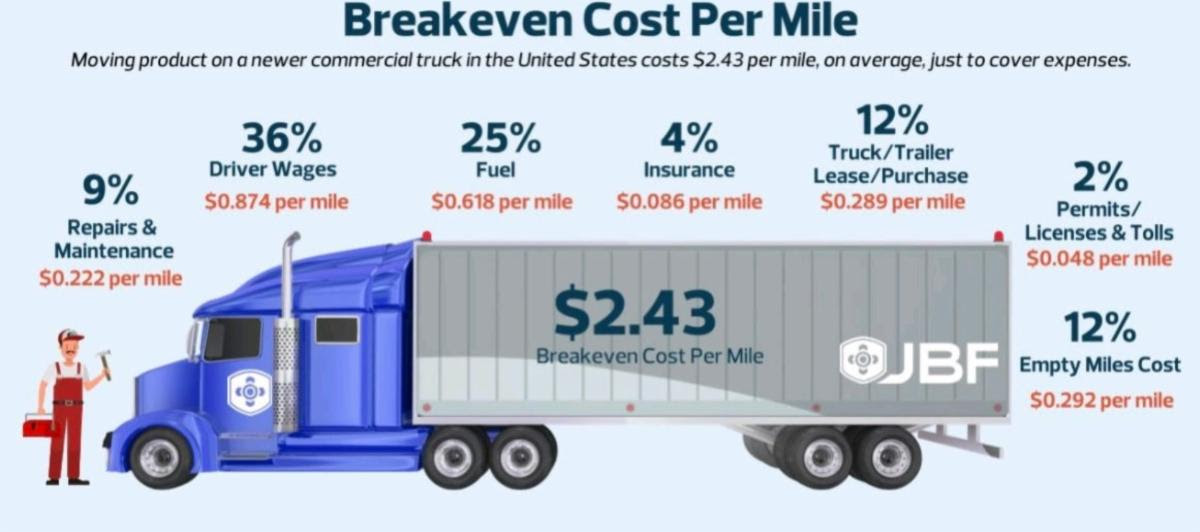
Truckload freight rates refer to the cost of transporting a full truckload of cargo from one location to another. These rates are typically calculated on a per-mile basis, although other pricing structures such as per-load or per-hour rates might be used depending on the circumstances. The average truckload freight rate in the U.S. for 2024 generally ranges between $2.00 and $3.00 per mile. However, the actual rate can fluctuate based on various factors, including the type of truck, the nature of the cargo, and the route taken.
2. Factors Influencing Truckload Freight Rates
Several key factors influence the cost per mile for truckload freight. Understanding these factors can help both shippers and carriers better navigate the complexities of freight transportation.
2.1 Type of Truck and Equipment
The type of truck and equipment used plays a significant role in determining freight rates. Different types of trailers and vehicles cater to various cargo needs:
- Dry Van Trailers: These are the most common type of trailers used for general freight that does not require temperature control. The average rate for dry van loads in 2024 is typically between $2.00 and $2.75 per mile. The lower end of this range often applies to longer, more consistent routes, while the higher end reflects shorter or more complex routes.
- Refrigerated Trailers (Reefers): For cargo that needs to be kept at specific temperatures, refrigerated trailers are used. Due to the additional costs associated with refrigeration and temperature monitoring, reefer rates are usually higher, ranging from $2.50 to $3.25 per mile.
- Flatbed Trailers: Flatbeds are used for loads that do not fit inside standard trailers, such as construction materials or oversized machinery. Flatbed rates generally range from $2.25 to $3.00 per mile. The cost can increase based on the complexity of loading and unloading processes, which often require specialized equipment and labor.
2.2 Distance and Route
The distance between the origin and destination of the freight shipment significantly impacts the rate. Generally, longer distances lead to lower per-mile rates due to economies of scale. However, very long hauls can sometimes incur higher costs if they cross multiple states with varying regulatory requirements or involve difficult terrain.
Additionally, routes with heavy traffic, challenging road conditions, or high toll costs can also affect rates. Carriers may charge more for routes that are known for delays or additional expenses.
2.3 Cargo Type and Weight
The nature and weight of the cargo being transported also affect freight rates. Heavier loads generally cost more to transport due to increased fuel consumption, wear and tear on the vehicle, and potential for requiring specialized equipment. Furthermore, hazardous materials or high-value items might require special handling, securement, and insurance, contributing to higher rates.
2.4 Seasonality and Market Demand
Freight rates are also influenced by seasonal fluctuations and market demand. During peak seasons, such as the holiday period or during harvest times, demand for trucking services increases, which can drive up rates. Conversely, during slower periods, rates may decrease as carriers compete for loads.
The broader freight market is also subject to economic conditions and fuel prices. For instance, when fuel prices rise, carriers may pass on these increased costs to shippers, leading to higher per-mile rates.
2.5 Geographic Location
Regional differences in freight rates reflect varying local economic conditions, regulatory environments, and supply and demand dynamics. For example:
- Major Freight Hubs: Areas with significant freight activity, such as Chicago, Dallas, and Atlanta, may see more competitive rates due to higher availability of carriers and trucks. Conversely, more remote areas may experience higher rates due to fewer available trucks and longer distances between loads.
- Regulatory and Tax Considerations: Different states and regions have varying regulations and taxes that can impact freight costs. States with higher tolls or fuel taxes may see higher rates to compensate for these additional expenses.
3. Trends and Predictions for 2024
As we progress through 2024, several trends and predictions can influence truckload freight rates:
3.1 Technological Advancements
Technological advancements, such as the adoption of telematics and real-time tracking systems, are likely to enhance efficiency and transparency in freight operations. These technologies can help optimize routes, reduce idle times, and improve overall logistics, potentially leading to more competitive rates.
3.2 Sustainability and Fuel Efficiency
There is a growing focus on sustainability and fuel efficiency in the trucking industry. The adoption of fuel-efficient vehicles and alternative energy sources, such as electric trucks, could impact freight rates over time. While initial investments in these technologies may be high, they have the potential to reduce long-term operating costs and affect pricing structures.
3.3 Economic Conditions
Economic factors such as inflation, changes in consumer demand, and shifts in trade policies can all influence freight rates. For example, economic downturns might lead to lower demand for freight services, potentially reducing rates, while economic booms can increase demand and drive up costs.
3.4 Regulatory Changes
Ongoing regulatory changes, including updates to safety standards, environmental regulations, and driver hours-of-service rules, can impact operational costs for carriers. These changes may lead to adjustments in freight rates as carriers adapt to new compliance requirements.
4. Conclusion
In summary, the cost per mile for truckload freight in the USA for 2024 is shaped by a complex interplay of factors including the type of equipment, distance, cargo characteristics, market demand, and regional conditions. Understanding these factors can help shippers and carriers make informed decisions and manage costs effectively. As the industry continues to evolve with technological advancements and regulatory changes, staying informed about current trends and predictions will be crucial for navigating the dynamic landscape of freight transportation.


